The examples below demonstrate some unfamiliar constructs. Take some time to execute, modify and experiment with the examples until you feel you have an understanding of what each expression does. Then, try to solve the problems below.
Index
      n←4 2 2⍴2,(4/1),(4/2),1 2 1 2 2 1 1
      n⍳2 2⍴2 1
      3⌷n
      3 2 1⌷n

      rain←?7 5 12⍴250   ⍝ Monthly rainfall in millimeters over 7 years for 5 countries
      rain[1 3 4;;]
      rain[;1;]

      alph←2 3 4⍴⎕A
      alph[;2 3;1 2]
      alph[;2 3;1]
Sort
      ({(⊂⍒⍵)⌷⍵}⍤1)3 3⍴⍳9
      ({(⊂⍒⍵)⌷⍵}⍤2)3 3⍴⍳9
      {(⊂⍋⍤1⊢⍵)⌷⍵}3 3⍴⍳9

      scores←?3 5⍴10
      ids←⎕A[3 5⍴15?26]
      scores[⍋scores]
      {(⊂⍋⍵)⌷⍵}ids,¨scores
      {(⊂⍋⍵)⌷⍵}scores,¨ids
      scores{(⊃⍋⍺)⌷⍵}ids,¨scores
Take / Drop
      3{(⍺-1)↓⍳⍵}7

      ¯2 2(↑⍤2)alph
      2 ¯2 2↑alph
      ¯2 1(↑⍤2)alph
      2 ¯2 1↑alph
Problems
-
Grille Cypher
A Grille is a cryptographic device consisting of a square sheet with holes cut out which, when laid on top of a similarly-sized character matrix, reveals a hidden message (see figure 1).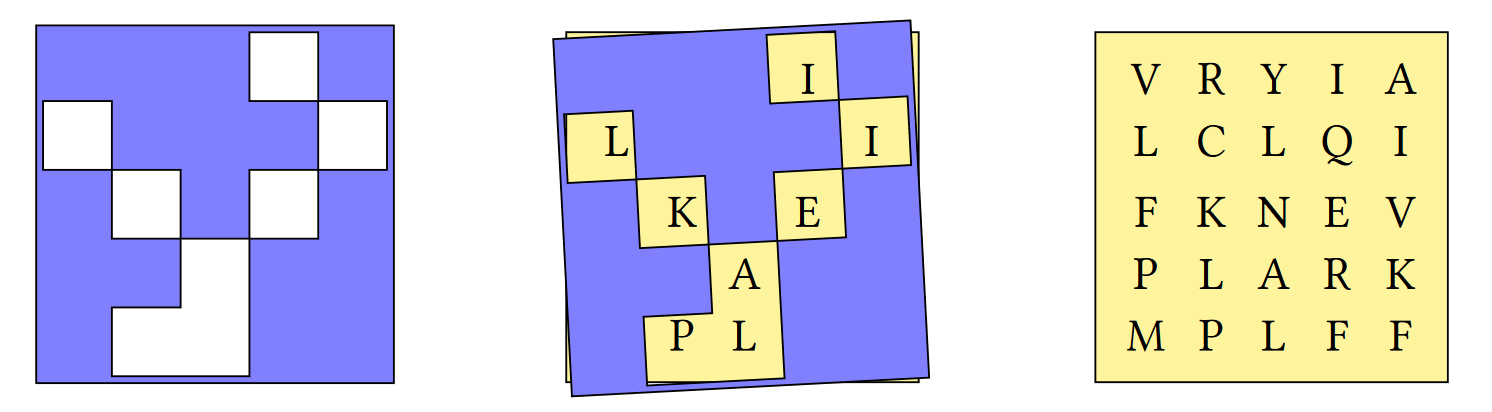
Figure 1. A grille and grid cypher Write an APL function
Grillethat implements an electronic version of a grille which:- takes a character matrix left argument, where a hash
'#'represents opaque material and a space' 'represents a hole. - takes a similarly-shaped character matrix right argumentcontaining the message.
- returns the hidden message as a character vector.
Example:
grid←6 6⍴'ESVWGTHOWTHZHIVSAICASSACFAAUCMNYMPCE' grille←6 6⍴'##### #### ## # # ## ### ## ## #####' grille grid ┌──────┬──────┐ │##### │ESVWGT│ │#### #│HOWTHZ│ │# # # │HIVSAI│ │## ###│CASSAC│ │ ## ##│FAAUCM│ │ #####│NYMPCE│ └──────┴──────┘ grille Grille grid THISISFUN - takes a character matrix left argument, where a hash
-
In the Range
Write a functionInRangeto select numbers from an array⍵which are within the range specified by a two-element vector⍺.2 6 InRange 3 4⍴1 3 8 6 2 5 5 8 4 10 9 10 3 6 2 5 5 4 -
Bar chart
Histograms are useful for representing frequency data. Before all the fancy charting applications of today, APL was quite adept at producing graphics from text.Write a function Histogram which produces a histogram from a vector of frequencies using the
.and⎕characters.Example:
Histogram 3 1 4 1 5 9 ⎕⎕⎕...... ⎕........ ⎕⎕⎕⎕..... ⎕........ ⎕⎕⎕⎕⎕.... ⎕⎕⎕⎕⎕⎕⎕⎕⎕ -
Checkout Sum
In a shop, each product is identified by a code. You are given the list of codes, and the corresponding prices:pcodes←56 66 19 37 44 20 18 23 68 70 82 prices←9 27 10 15 12 5 8 9 98 7 22A customer gives you a list of items he intends to buy as a vector of code/quanitity pairs in the form
code,quantity, code,quantity, code,quantity...wanabuy←37 1 70 20 19 2 82 5 23 10Write a function
Evaluatewhich takes a left argument nested vector(pcodes prices), a right argument integer vectorwanabuyand returns the customer’s bill. You will likely want to solve this using several lines of APL.(pcodes prices) Evaluate wanabuy 375 -
Monthly Sales
You are given a vector of sales data for3products over2years. The first12elements are sale for the first product for the first year, the second12elements represent sales of the 2nd product in the first year, and so on.sales←223 94 294 181 85 80 81 151 249 269 4 97 79 4 79 122 27 178 22 258 128 285 37 247 297 258 60 9 133 193 210 282 157 200 283 20 41 252 26 279 167 264 92 34 177 109 137 154 298 296 85 173 218 174 165 265 277 46 90 32 163 142 160 139 63 224 173 239 279 41 260 271- Compute the total sales of each of the
3products. - Compute the total sales for each year.
- Compute the total sales by month across both years. The result is a vector of length
12. - Compute the total sales for each month for each of the two years. Your result should be matrix of shape
2 12. -
The tax on sales varies by product, and changes each year. The tax for each product for each year is given in Table 1.
Product 1 Product 2 Product 3 Year 1 20% 18% 5% Year 2 17.5% 12% 3% Table 1. Made up taxes
- Compute the total tax on product 3 over 2 years
- Compute the total tax on all products in year 2
- Compute the total sales of each of the
-
じゃんけん (Janken)
In a rock-paper-scissors tournament, 5 players play 4 games each round (once against each other player) for 3 rounds.ids←'ABCDE' scores←5 3⍴2 3 1 2 1 2 1 2 2 3 2 4 2 2 1 -
Write a function
TopScoreswhose right argument⍵is a matrix with with≢⍺rows, which returns the IDs of players with the highest score for each round.ids TopScore scores DAD